Posted on

Heat, Energy, and Temperature

Defining terminology:
The total of all energy in an object is its internal energy.
Heat is not the energy the body contains but the energy transferred from one body to another.

We can make clear distinctions between temperature, heat, and internal energy.
Temperature is a measure of the average kinetic energy of the individual molecules.
Internal energy is the total energy of all of the molecules in the object.
Heat refers to the transfer of energy from one object to another due to a difference in temperature.

The heat required to change the temperature of a material is proportional to the mass of the material and the temperature change. (Commonly seen as Q = m*c*deltaT)

Posted on

Launch Control, antilag, and rev limiters

rev limiters, launch control, and antilag, are all different things.
Antilag is typically accomplished via combustion continuing into the exhaust manifold to spin the turbocharger, but without accelerating the engine. This can be at light part throttle or zero throttle by the driver, but the system will hang the throttle open slightly (or slightly more than standard target) and allow more mass flow through the turbo. it will also add more fuel and greatly delay ignition. The result is a lot of really hot exhaust gasses to spin the turbocharger. You usually do as little of this as possible, as this will melt almost any turbo charger and manifold. Usual best implementation is closed loop on turbine speed (and on a car with lots of cam control and DBW). Just enough energy to hold turbine speed target is the goal, as more will be excess heat/energy dumped into the components.
Launch control is a system to aid the driver in getting off the line more efficiently. This generally means minimizing wheelspin. This can be used in cases where traction control is illegal or otherwise unavailable, as most sanctioning bodies will let you ride preset torque or speed/acceleration targets as long as the system is not closed loop.
Rev limiters are a method of preventing overspeeding of the engine under its own power. This can be accomplished by cutting air, cutting fuel, or cutting ignition.

Posted on

Differentials

The purpose of the differential is to allow two wheels to turn at different speeds while coupled to one shaft.

With the two sides coupled and no speed differential possible, as in a “locked” or “spool” or “welded” differential, the drive power when turning is substantially higher as slip is required on one side or the other. Likewise, steering is compromised as the vehicle will want to continue straight, and in worse case scenario, steer wheel slip occurring before drive wheel slip will make that so.

The open differential allows the outside and inside wheels to turn at different speeds, and any speed so long as the sum of the two speeds is a constant. The open differential also equally divides the torque between the two wheels, but if one wheel slips, twice the torque will be available to the slipping wheel. That the wheel that gets more torque is always the slower wheel, the slower wheel is always the inside wheel, and the inside wheel is always the least loaded wheel,  is one of the reasons the open differential is not an ideal solution for a performance application.

Most differentials of the “limited slip” variety fall somewhere between an open differential and a locked differential.

The various methods include Viscous, Torsen, and Salisbury, with a few that are variations on those themes.


Viscous differentials use a high viscosity fluid in a special “clutch” that has tight tolerances but without actual contact. Unlike most oils which reduce viscosity with temperature, the oil used in a viscous LSD general increases viscosity with temperature. The higher viscosity fluid creates more drag (which increases further with additional drag and temperature) between the plates. That drag between plates is drag between the two sides of the outputs. The advantage to this design is that the “wear” component is the fluid. In conventional cornering, the differential will act as an open unit. With wheel spin events, the slip creates heat which creates the lockup, but that is a relatively slow process. This time lag, and variability in lockup with unit temperature as well, makes tuning a differential like this for track use difficult.


Torsen differentials use helical gears with spur gears instead of the spider gears found in an open differential. This differential also can act like an open differential at zero load or light load. The gear meshes are loaded by input torque, and with sufficient torque, the two sides are essentially locked. How “locked” and at what input torque, is a function of the design itself, and cannot be varied easily. Lockup follows input torque, thus more torque is more lockup, which may or may not fit the speed/gear/turn radius of your particular track. Lower gears / lower speeds means more input torque available, but often when at lower speeds, it is because of a tighter turn. More lockup in a tighter turn can be a disadvantage, and not enough lockup in high speed turns can also be a disadvantage. Finding the right balance is critical.


Salisbury differentials use clutch packs, spider gears, and ramps. The spider gears sit on shafts in “ramps”. As input torque is applied, the spider gears on those shafts are turned, and the shaft spreads the ramps. The ramps load clutches, which can progressively lock the output shafts together. The variables in this type of differential are many. Preload can be varied, and controls “unloaded” lockup. Bias ratio can be changed by changing the ramp angles. Load sensitivity can be changed by changing the number of clutch plates.

With the ramp angles variable, you can greatly vary the effect. Near 90 degrees, and no lockup will occur with input torque. Near 0 degrees and full lockup will occur with little input torque. Those ramp angles can be varied by direction as well, so different acceleration ramps and deceleration ramps are possible. Preload is adjustable, and as the name indicates, is the “lock” between the shafts at zero input torque load. The level of adjustability in this differential is why it is a standard for use in race applications.

Posted on

Throttle Mapping on DBW cars

In modern cars, there is no longer a “throttle cable” linking the throttle pedal to the throttle bodies. Now we have a throttle pedal that is a sensor/input to the ECU, and the ECU controls the throttle bodies. This is known as “drive by wire”. This has a number of advantages. One of the biggest is that the ECU is no longer reacting to throttle changes and trying to respond to this with changes in fueling, it now knows this is happening and can make changes to fueling in sync with the throttle changes. Another major benefit is that we can easily alter the “sensitivity” of the throttle pedal, and the mapping of throttle pedal to throttle body, or throttle pedal to target torque, depending on the ECU’s control structure.

With the ability to alter the “effect” of throttle position and throttle change on the drivability of the car, we open up a new world of parameter tuning. A system that is more responsive with smaller throttle changes will “feel” more “sporty” or “more powerful”. Often, this is accomplished by a non-linear throttle mapping, where 10% at the throttle pedal could be interpreted as 20% by the maps in the ECU, 20% as 40%, etc. This will make the engine feel more powerful to the driver, but 100% will still need to be 100%, so the actual power of the engine has not changed. The downside to this (especially as we search for the “what is too much” point) is the decreased fine throttle control.

If we look at fine throttle control, it may be of an advantage to make certain areas of the throttle less responsive. This is especially true in conditions were available torque may exceed available grip, and thus the driver will need to modulate the throttle in order to not spin the tires. On cars with traction control, they may or may not do this well enough to be “better” than driver control. In either case, traction control can be rough on the drivetrain in many applications, as the torque cut can be drastic and hammer the components. (Much like ABS can be helpful, but still not as good as a good driver.) On cars that do not have these features (traction control specifically for this discussion), the throttle mapping allowing for better control and thus less wheel spin will help with vehicle balance via tire temperature, and thus also tire wear.

This mapping will of course be very driver specific, and within the constraints of most of the ECU’s, adding resolution/linearity in some areas might mean giving up some of that in others. That compromise is what is needed to be adjusted to fit the car, driver, and track.

The driver being a large part, but the chassis being a key player too. A good example of that interaction between driver/car/throttle is corner exit. How (and how quickly) that torque change is requested might provide wheel spin in some cases, but might also provide the initial torque bump to help lock the differential more in other cases. The interaction between the driver and the differential, especially in a more conventional limited slip differential like a Salisbury, is controlled by the throttle pedal.

Posted on

Vehicle Road Testing – Part 2

In part 1 of this article, we discussed the principles for gathering coast down data. There are a number of things that can be determined from that data.

We can calculate the aerodynamic drag and rolling resistance components of the total drag. The large component at high speed will be aero drag. It will vary with the square of velocity.

Total Drag = ( (Coefficient of Drag)  x (Air Density) x (1/2) x (Velocity ^ 2) * (Frontal Area) ) + (Rolling Resistance)

If we plot Total Drag vs Speed, we can identify a “floor” at very low speed. In the last few MPH, that floor is rolling resistance. Subtract that from Total Drag, and we have a plot of Aerodynamic Drag versus Speed, and can then use our estimate of Frontal Area from Part 1 to calculate the drag coefficient.

In making changes to the vehicle for evaluation, the aerodynamic results are often easier to spot. We can verify our drag coefficient by doing simple tests, like removing side view mirrors, and subtracting that frontal area from our calculated frontal area, and re-run the tests to see if we end up with the same drag coefficient.

We also need to be careful in making changes to other bits and the “measured” effect on rolling resistance. For example, changing to lighter or heavier wheels or brakes should not impact the rolling resistance or the aerodynamic drag in a large or measurable way. It will, however, add to the inertia of the vehicle, and more specifically on those two, to the rotational inertia.

We can use that information to calculate the driveline inertia influence. We can also measure the inertia of the wheels, tires, brake rotors, and hubs, and use the radius of the wheel to calculate/verify the above.

Posted on

Roll sensitivity basic calculations setup

Roll sensitivity describes how far the car will roll given a certain cornering force applied. Depending on the direction of the calculation, any number of the variables in this can be solved with a combination of knowns and assumptions. This can help not only calculate load on a given tire or suspension point, but allow for measuring (and correcting) suspension geometry change.

If we assume that we are working with “known” spring rates and sway bar rates, we can skip those calculations. Those can also be directly measured off of the car.

So we are going to make a bunch of assumptions here. First of which is that the front and rear roll center heights are the same. This will make things easier in that the neutral roll axis is level with the ground. Effects of suspension geometry are also being neglected here. Tire deflection rates are assumed to be included in the roll rate values. CG and roll centers are in the center of the car, etc.

Thus, we have a moment, M, that is equal to the negative of the center of sprung weight (W) times the distance that sprung weight is above the neutral roll axis (h) times ( lateral acceleration (A) minus the roll angle of the chassis R)
I should probably note that if the neutral roll axis is inclined, we have to find the line perpendicular to the neutral roll axis that intersects the center of the sprun weight and find the length for that line and thats h.
Might be easier to read that in true equation form:
M = -W*h*(A-R)
The negative sign is there so that if A is positive (right hand turn), then the moment on the sprung mass is negative. This means that the roll angle is negative, and the car rolls to the outside of the turn. I’ve seen it written with the negative sign on the other side of the eqn before, but this way makes more sense to me.

Then we have a force F at height h is the same as force F at the origin on the neutral roll axis and a moment M (from above). You can also take that force F and split it amongst the front and rear axle according to the weight on each axle. For our example with a 50/50 weight distribution, the force would be split evenly, which keeps things simple. but far from real world. This force will produce load transfers separate from roll rates.
Back to finding roll angle though. The moment M will produce a roll angle R measured in a plane perpendicular to the neutral roll axis. (This, also, is why we are keeping the height of the front and rear roll centers even.) The magnitude of the roll angle will depend on the sum of the front and rear roll rates. We generally assume the roll to be about the neutral roll axis.
If we equate the Moment M to the roll stiffness moment we get:
Roll rate ( R) / lateral acceleration (A) = (negative of the center of sprung weight (W) times the distance that sprung weight is above the neutral roll axis (h) ) / (front roll stiffness (Kf) + rear roll stiffness (Kr) – center of sprung weight (W) times the distance that sprung weight is above the neutral roll axis (h)) = roll sensitivity (Kroll) Roll sensitivity here is expressed in radians per g of lateral acceleration.
Written as a more easily readable equation that is:
R/A = (-W*h)/(Kf+Kr – W*h) = Kroll

We then can split the moment M to front and rear components. The F gets combined with this too to give load transfer at each axle.
What we are looking for though is a way to express lateral load transfers for the front and rear as related to lateral acceleration.
The equation for the front will be:

Change in weight on axle / A = (W/t) * ( ( (h*Kf’) / (Kf + Kr -W*h) ) + ((l
– a) / (l)) * roll center height of axle) + (unsprung weight of axle / track of axle) * height of roll center of axle
This is for where Kf’ = Kf – (l – a) W*h/l

The equation for the rear will be:
Change in weight on axle / A = (W/t) * ( ( (h*Kr’) / (Kf + Kr -W*h) ) + ((a) / (l)) * roll center height of axle) + (unsprung weight of axle / track of
axle) * height of roll center of axle
This is for where Kr’ = Kr – a W*h/l

l is the distance between the unsprung weight centers.
a is the distance between the center of unsprung weight at that axle and the center of sprung weight for the vehicle.

Notice they are very similar equations. The difference to note is the l-a term for the front and the a term for the rear. L is the distance between the front and rear roll centers. a is the distance from the front roll center to the center of the sprung weight. All on the x axis with plane orientation between those centers not taken into account.

If we make the assumption that this is a single mass system and assume a bunch of other stuff for the sake of making the math not a huge pain, we can get the equations down to:

R/A = (-Wh)/(Kf + Kr) = Kroll

==

Front roll rate / A = (vehicle weight / front track width) *((h*Kf)/(Kf+Kr)+(distance from roll center of axis to center of mass / distance between front and rear roll center)*front roll center height)

Posted on

Vehicle Road Testing – Part 1

Enhancing the performance of a vehicle isn’t always limited to making more power. Often more speed can be found by using less power to push the car through the air or along the ground.

The best way to evaluate the effect of a change on a car is via controlled testing.

We will need to know a few things about the car. The weight, and the frontal area.

Weight should be measured in “as tested” trim, and as precisely as possible. Truck stops, recycling centers, and city dumps have scales that may only be accurate to 100 lb increments whereas race scales may give tenth of a pound resolution.

Frontal area can be measured or approximated with a photograph taken head on of the vehicle, or via careful tape measure of “bounding boxes” on the car. More precision is better, but “close enough” is likely good enough. The frontal area number used affects the value of coefficient of drag when calculated. Much of this depends on what sort of testing you wish to perform, and what information you would like from the results.

Low speed coast down testing will allow the calculation of rolling resistance.

High speed coast down testing will allow the calculation of aerodynamic drag.

Ideally, the tests are done on flat ground, run in both directions, and repeated numerous times to validate the data. Running in both directions does remove some of the issues imposed by non-flat ground, but the test area should be as flat as possible. Notes should be taken on track temperature, air temperature, and atmospheric pressure as these can have an effect on the results. Having that data will let you compare results from different days/sessions more cleanly.

Data from coast down testing will allow you to determine aerodynamic drag and rolling resistance, but will then let you compare and re-test with different components. This additional testing will then let you calculate driveline inertia (including inertia from wheels, brake rotors, and tires).

We generally start by calculating the total drag force, using F= M x A. Acceleration data can be used from accelerometers or GPS data. The more precise, the better.

With total drag force, we can split aerodynamic drag from rolling resistance. (aerodynamic drag = total drag force – rolling resistance)

Rolling resistance is largely linear, and can be treated as constant for the sake of simplicity in calculations, whereas aerodynamic drag varies with the square of velocity. Treating rolling resistance as constant simplifies the calculations, but if sufficient data is collected, a curve can be fit to rolling resistance if desired.


Posted on

Trouble codes on your OBD1 BMW

Trouble Codes OBD1If your BMW was manufactured between the late 1980’s and 1995, you should be able to pull diagnostic codes out of the car via the check engine light.

To read these codes, turn the key to position two (run), but do not start the engine. Within 3 seconds of turning the key to position 2, you will need to stomp the gas pedal from idle (not touching the pedal) to WOT (wide open throttle, to the floor) and back, 5 times. If you successfully do this within the 3 second window, the check engine light will turn off, then a long on, then off again, and then begin flashing the codes out to you. If there are no stored codes, it will still flash something out, as there is a code for that too. If you get a constant lit CEL, turn the ignition off and try again.

The code for “no codes stored” is 1444, which would be presented as on-off-on-on-on-on-off-on-on-on-on-off-on-on-on-on-off-on-on-on-on followed by a long off, a long on, and then repeating.


System Error Code
DME Control Unit 1211
Air Mass/Volume Sensor 1215
Throttle Potentiometer 1216
Output Stage, Group 1 1218
Output Stage, Group 2 1219
EGO(O2) Sensor 1 1221
EGO(O2) Sensor 2 1212
Lambda Control 1 1222
Lambda Control 2 1213
Coolant Temp. Sensor 1223
Intake Air Temp. Sensor 1224
Knock Sensor 1 1225
Knock Sensor 2 1226
Knock Sensor 3 1227
Knock Sensor 4 1228
Battery Voltage/DME Main Relay 1231
Throttle Idle Switch 1232
Throttle WOT Switch 1233
Speedometer A Signal 1234
A/C Compressor cut off 1237
A/C Compressor 1242
Crankshaft Pulse Sensor 1243
Camshaft Sensor 1244
Intervention AEGS 1245
Ignition Secondary Monitor 1247
Fuel Injector 1 (or group 1) 1251
Fuel Injector 2 (or group 2) 1252
Fuel Injector 3 1253
Fuel Injector 4 1254
Fuel Injector 5 1255
Fuel Injector 6 1256
Fuel Injector 7 1257
Fuel Injector 8 1258
Fuel Pump Relay Control 1261
Idle Speed Actuator 1262
Purge Valve 1263
EGO Heater 1264
Fault Lamp (check engine) 1265
VANOS 1266
Air Pump Relay Control 1267
Ignition Coil 1 1271
Ignition Coil 2 1272
Ignition Coil 3 1273
Ignition Coil 4 1274
Ignition Coil 5 1275
Ignition Coil 6 1276
Ignition Coil 7 1277
Ignition Coil 8 1278
Control Unit Memory Supply 1281
Fault Code Memory 1282
Fuel Injector Output Stage 1283
Knock Control test Pulse 1286


Posted on

Boost Controllers

IMG_8117

The primary control of boost in a turbocharged system will be the wastegate. The purpose of the wastegate is to bypass the turbochargers turbine, reducing its ability to make boost. (For more information on how the turbocharger works, see our article on turbochargers.)

The wastegate will have a pre-set spring pressure. This can be adjusted by changing the spring on most, and also by varying the preload of that spring in some others. Outside of that, a boost controller can be used.

Boost controllers come in a variety of different types, however, there are only two methods for raising the delivered boost; you must either reduce the pressure on the bottom port of the wastegate, or add pressure to the top port (if available) on the wastegate.

IMG_8148For reducing the pressure on the lower port on the wastegate, there are two popular methods. One is a “controlled bleed”. This is found in mechanical boost controllers that are “needle type” valves, as well as the method used by some electronic boost controllers by pulsing a solenoid to control the amount that is bled off. The other is to artificially hide the boost signal from the wastegate until an alternate target boost is reached, as is done mechanically with a “ball and spring check valve”. Some electronic boost controllers use this method as well. Some electronic controllers also will blend between the two, hiding the boost from the wastegate until a target pressure is reached, and then acting like a controlled bleed once that target is reached.

Both of the above are common implementations using only the lower port on the wastegate. The top port is also very useful in that you can leave the bottom port unmolested, and add pressure to the top port only when more boost is desired. Usually this is only something that electronic boost controllers will use, but some mechanical boost controllers also take advantage of this port.

On electronic vs manual controllers, it strongly depends on which versus which. In general, electronic controllers have an advantage of being able to react in a non-purely-mechanical means. So if you have a mechanical system that becomes inefficient and tapers at higher RPM, some electronic systems give you the ability to compensate and command more boost at higher RPMs. Mechanical systems tend to only be able to translate the natural boost curve up, but not drastically alter its shape.

Posted on

Engine Calibration and your BMW

IMG_8132

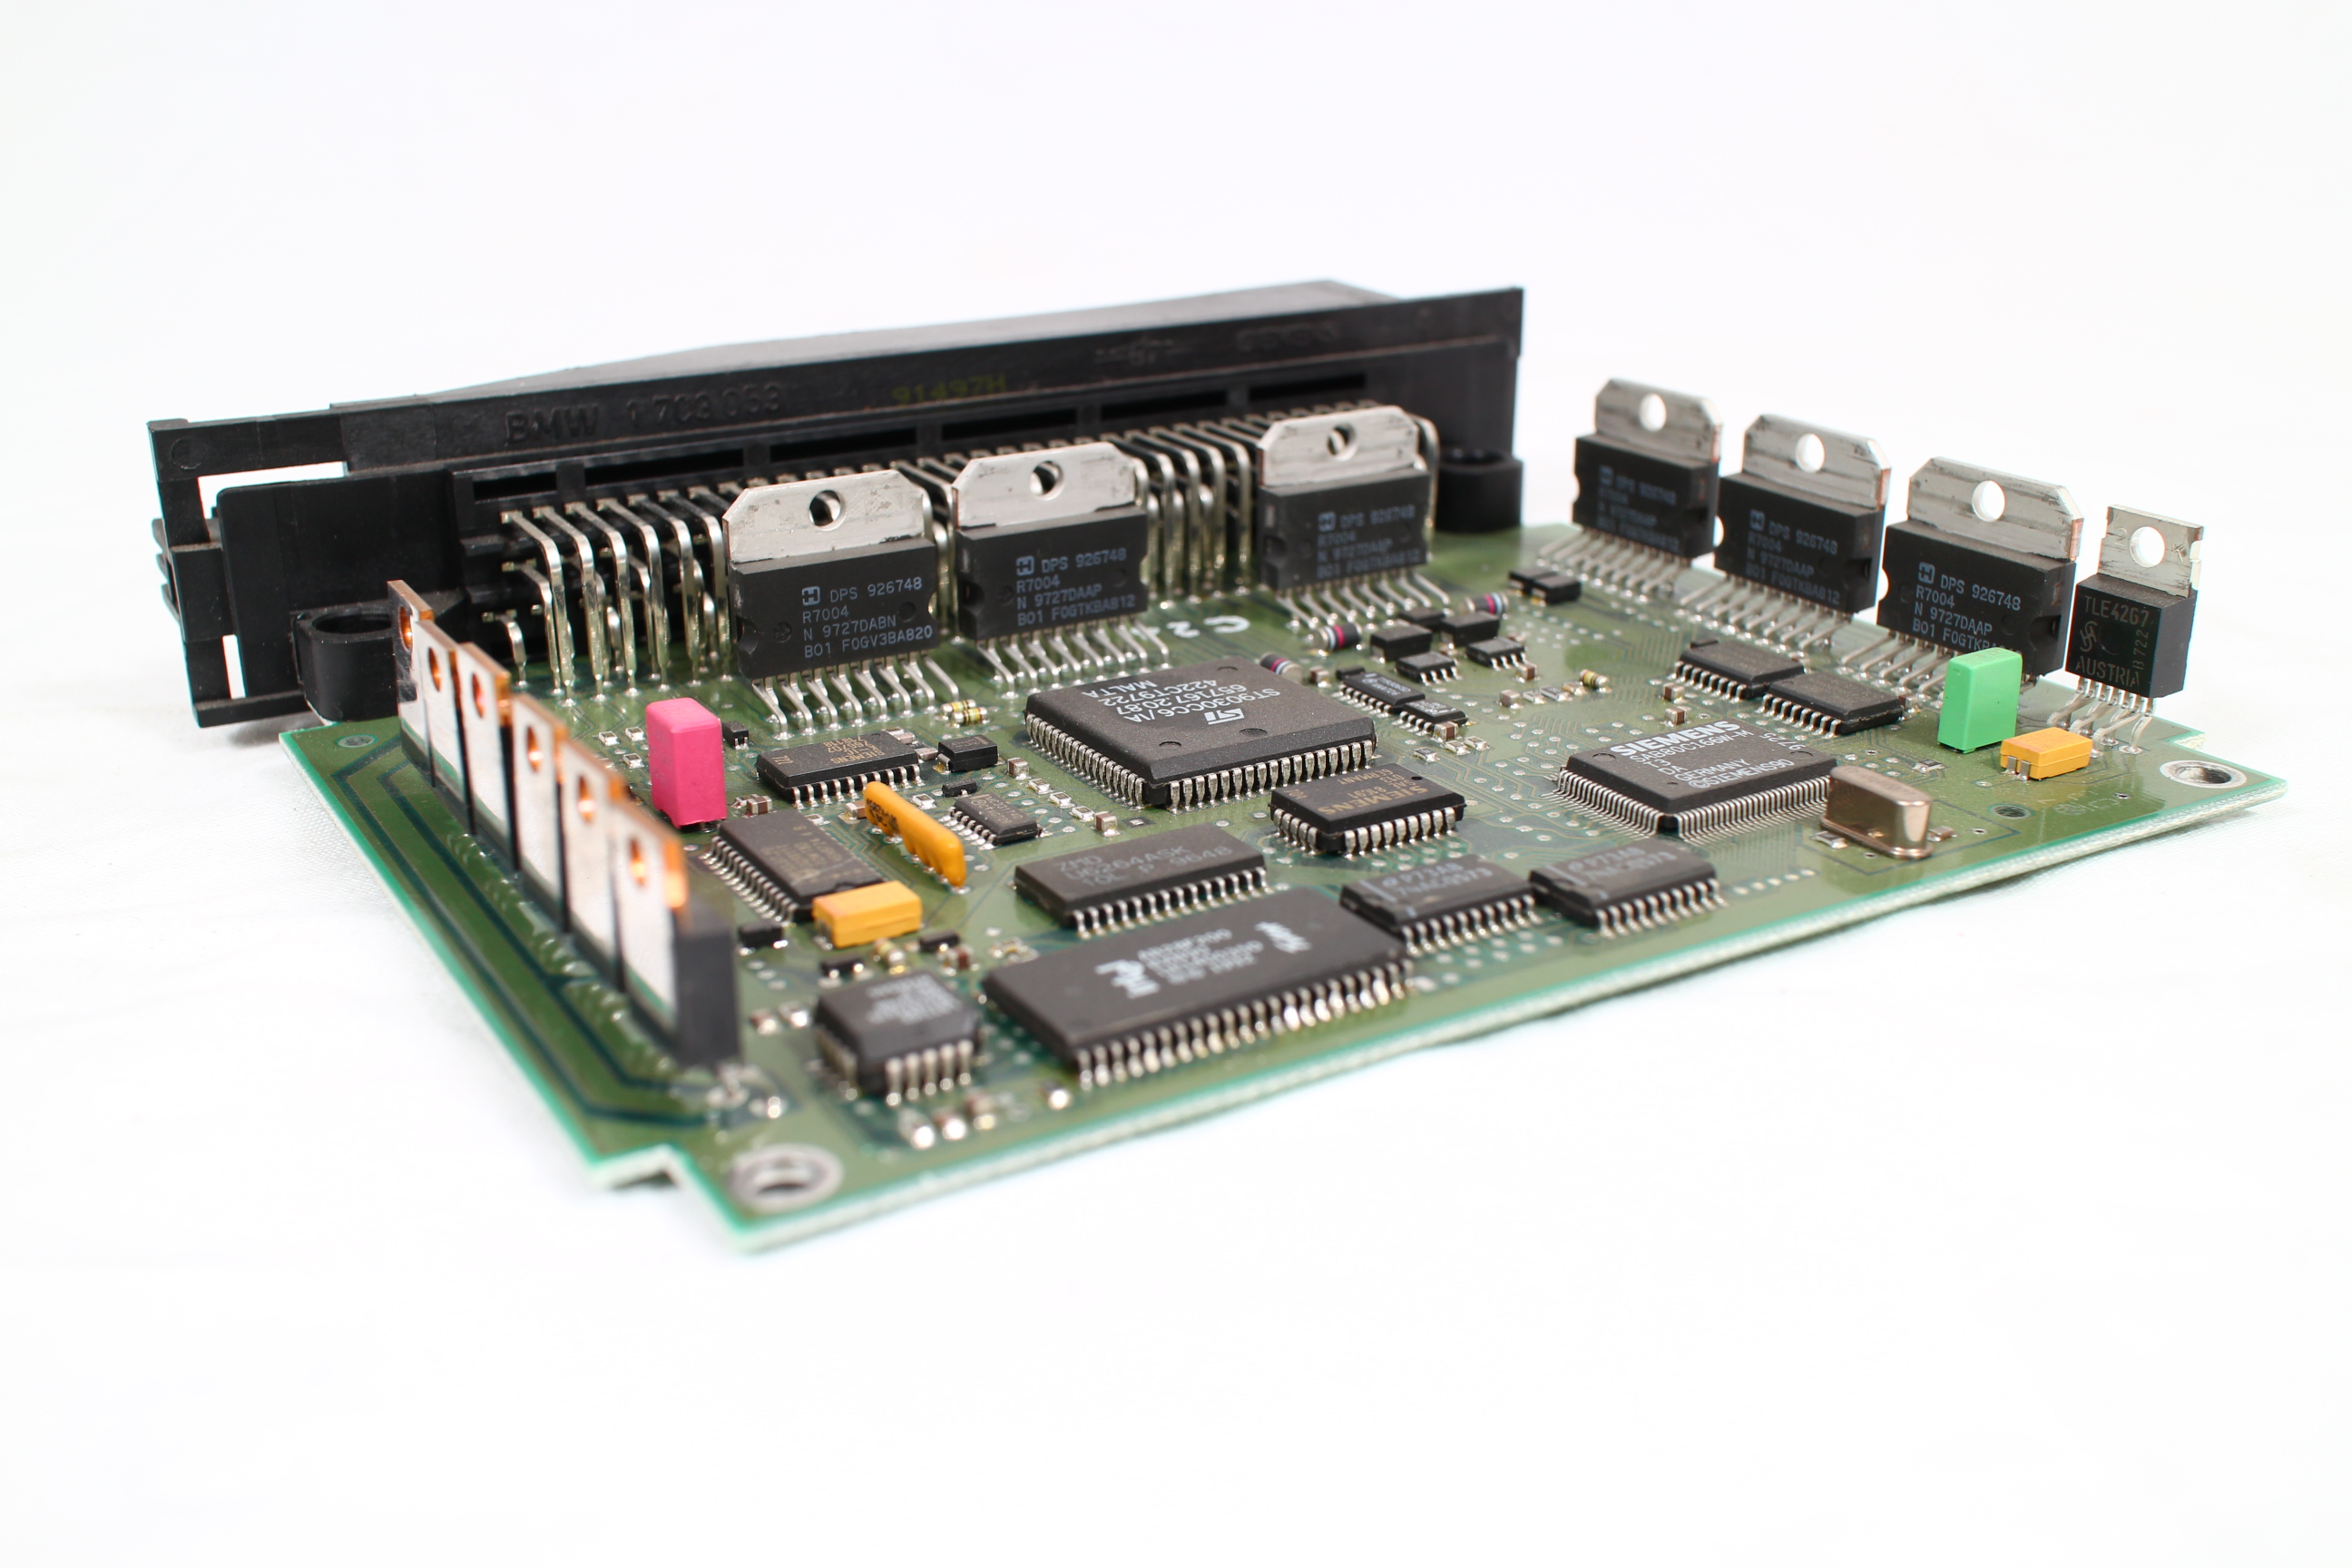
If you own a BMW manufactured after the 1970’s, there is some sort of computer controlling the fuel delivery to the engine. By the 1980’s all of the BMW cars in the US had some sort of fuel and spark control based on a piece of electronics. This computer would use various load inputs, such as throttle position and air flow measurements, to determine how much fuel is needed. It would also use that data to determine the best time to fire the spark plug. As the engines became more sophisticated, so did the computers controlling them.